Open Cities 3 The Case of London
Open Cities 3
The Case of London
Openness or diversity?
London is by far the largest city of the European Union and arguably the most diverse in terms of its population, economy and cultural characteristics. How does London fare with openness though?
A diverse city does not necessarily mean an open city
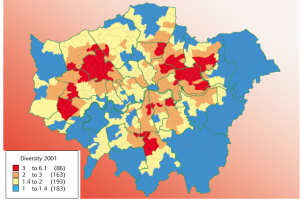
London’s ethnic population diversity 2001
The Open Cities research aims to establish an index which should enable cities to position themselves in som
e openness league. How able would such an index be to capture degrees of (in-) equality in London’s real life? And how would it rate openness in terms of equal opportunities for diverse cultural and socio-economic groups?
Inclusiveness – multi-culturalism – cosmopolitanism?
Inclusiveness, (a proxi to openness?) is, and has figured on London’s political agenda for decades. London’s multicultural history rests on its port, trade, empire, industry and services, and on its role as a global financial market place. London has a legacy as the capital of an empire; it remains the secretariat of a commonwealth and a major player among western powers. Twinned with New York, Moscow and Berlin it has friendship agreements with countries throughout the developing world. London claims to be one of the most cosmopolitan cities in the world.
Population flows: diversity or segregation?
People have been moving in and out of London over centuries. Founded by the Romans, London was joined by the Anglo-Saxons, overrun by Vikings and Normans. It has been hosting minorities over centuries such as Huguenots, Jews and many others who all brought with them their skills and cultures. London deliberately attracted and is attractive to citizens from all social strata of its commonwealth. Alongside it is open to EU citizens and a high earning elite. Migrants, students, workers, refugees, all sorts of transient people are constantly arriving, some are settling here. People are also leaving London, returning home, moving on, emigrating.
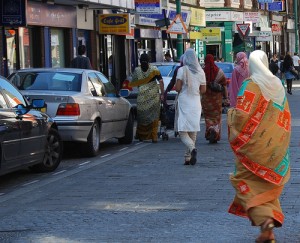
- Dia 1 London’s ‘Bangla-vil

Dia 2 London black community
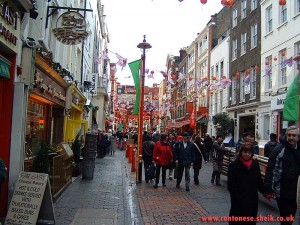
Dia 3 London’s China Town

Dia 4 London’ Jewish community meeting the pope
How do these continuous population flows shape London’s openness?
How could interactions between human fluxes and the host city be measured ‘objectively’?
How could they be captured in an openness index?
Data from the Greater London Assembly shows that London’s 42% population of foreign origin is increasing both through migration and births. The largest minority group comes from Asia, followed narrowly by Africans, then Irish, Europeans, North Americans, Australians and New Zealanders. Already in two London Boroughs ethnic minorities exceed the long term established population and by 2031 this will have extended to six Boroughs. Some concentrations of minorities in specific wards remain high, the Bangladeshis and Pakistanis in the East End, the Caribbean Africans in North West London, the Black Africans in Inner South London, the Cypriots and Jews in different North London Boroughs, the Middle East Arabs in Central London. Meanwhile, big sways of the outer London suburbs remain predominantly white. Analyses of ethnic segregation have labelled 20 wards as ‘mixed enclaves’ where ethnic minorities constitute two thirds of the population albeit from different ethnic groups, while the concentration of single ethnic groups tend to decline in London. Data shows that minorities are moving about within London and dispersing outward with increasing affluence.
Does this mean that London’s diverse population is becoming more integrated?
Diversity Index
The Greater London Authority has established a diversity index by ward (the smallest territorial statistical entity in the UK) using Simpson’s Diversity Index scores for 1991 and 2001. The Data Management and Analysis Group affirms that they are able to measure ethnic diversity statistically. They found that ethnic diversity had increased significantly within ten years. They also discovered that in London’s most segregated wards, Spitalfields and Banglatown, where one ethnic children group makes up two thirds of all children. Can lessons can be learnt from the Simpson’s Diversity Index for an ‘openness’ index of cities?
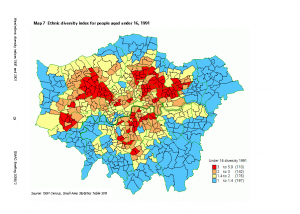
Dia 5 London Diversity Index 1991 Source dmag
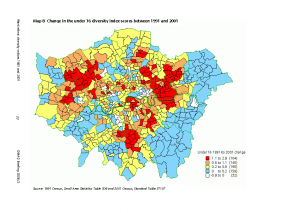
Dia 6 London Diversity Index 2001 Source dmag
The diversity index shows that segregation can be relatively low while diversity is high.
End
